

Dashboard & Reporting
The uniqueness of Decise is the AI Dashboard and Reporting features provided to your Organization, in a User Friendly manner.

In this section we discuss

AI Decision Dashboard
What-if Analysis
Dashboard Comparisons
Reporting
AI Decision Dashboard
What-if Analysis
Dashboard Comparisons
Reporting
AI Decision Dashboard
A main reason for choosing Decise is the AI Decision Dashboard feature. Using Bayesian Network AI and traditional decision analytics, Decise calculates in seconds the important insights needed to understand a decision quickly.
View a Dashboard
There are two ways to view a dashboard in Decise.
From the decision detail screen
1. Navigate to any decision from the Decisions area in the left side navigation panel
2. Ensure all mandatory questions for the Dashboard are answered.
3. Select the Financial Version you want the AI to use for this decision.
4. Press the Dashboard button.
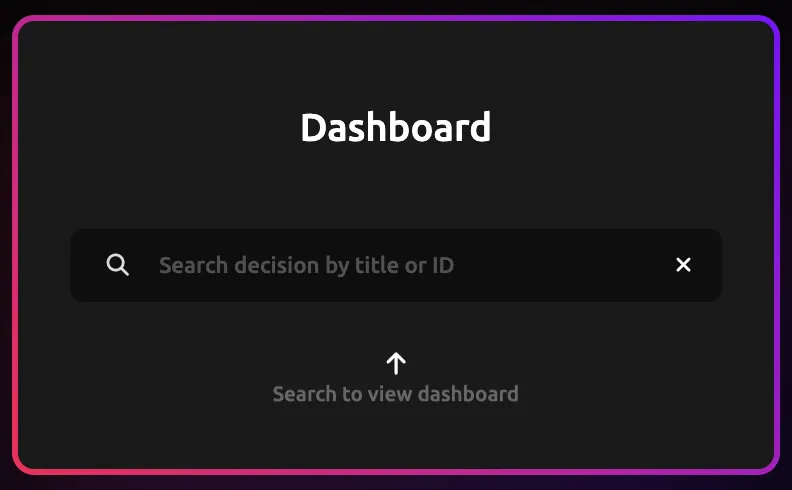
From the dashboard screen
1. Navigate to the Dashboard area from the left side navigation panel.
2. Type the Decision Name or the Decision ID to search for the decision.
3. Press Enter.

Understanding the Dashboard Metrics
Should the organization proceed with this project?
This metric provides the probability of the decision meeting its stated objectives. It can be used as a high-level recommendation based on a balanced evaluation of your responses to relevant questions such as strategic alignment, value potential, risks, and resource feasibility. It helps decision-makers quickly understand whether the proposed project is worth pursuing. Drawing on input from stakeholders and weighted criteria, this insight supports more confident, aligned, and accountable project decisions. Values closer to 100% suggest it is highly probable to be a successful decision for the organization.
Cost / Benefit Ratio
The Cost Benefit Ratio measures the relationship between the projected benefits of a project and its expected costs. A ratio above 1.0 indicates that the benefits outweigh the costs, suggesting a potentially worthwhile investment. This metric helps organizations compare initiatives objectively and prioritize those that deliver the greatest value for money.
Expected ROI
Expected ROI estimates the percentage return a project is likely to generate based on projected gains relative to its total cost. It provides a quick snapshot of potential financial return, helping stakeholders compare opportunities and assess whether the investment meets the organization’s risk and reward thresholds. A higher ROI suggests stronger financial justification for proceeding.
internal Rate of Return
IRR is the projected annual rate of return a project is expected to generate over its lifetime, expressed as a percentage. It helps determine the profitability of an investment by identifying the discount rate at which the project’s net present value (NPV) becomes zero. A higher IRR generally indicates a more attractive investment, especially when it exceeds the organization’s required rate of return.
Balance Sheet Improvement Post Project
This metric estimates the expected positive impact a project will have on the organization’s balance sheet once completed. It considers changes to net impact to the balance sheet — due to increased cash flow or profits. The result helps assess how the project contributes to the company’s overall financial strength and long-term stability.
Probability of the Project Running on Time
This metric reflects the likelihood that a project will be completed within its planned timeline, based on the project specifications, resource capability and complexity. A higher probability suggests strong scheduling confidence, while a lower one may indicate probability of potential delays in implementation.
What is the probability that this decision makes my business better off?
This metric indicates the likelihood that the decision will lead to a net positive outcome for the business—financially, operationally, or strategically. It combines stakeholder input, projected benefits, risks, and alignment with business goals to assess the overall advantage of proceeding. A higher probability signals stronger confidence that the decision will create meaningful value.
Reasons for Lower Success
This insight highlights the specific factors contributing to the lower overall decision "proceed" rating, based on our seven core evaluation criteria. The marker on the bar indicates which of the 7 criteria is potentially reducing the probability of success for this decision — so that stakeholders can address issues early or reconsider the approach.
What is the probability of sustained benefit from the project?
This metric estimates the likelihood that the project's benefits—such as cost savings, revenue growth, efficiency gains, or customer improvements—will continue well beyond its completion. It considers factors like long-term alignment with business strategy, operational readiness, scalability, and change adoption. A higher probability suggests the project is not only effective in the short term but also built for lasting impact.
Payback Period
The Payback Period measures how long it will take for a project to recover its initial investment through cost savings or revenue gains. It helps stakeholders understand the time horizon for breaking even, making it a useful indicator of risk and liquidity impact. A shorter payback period generally signals a faster return and lower financial exposure.
Profitability Index
The Profitability Index shows the net value created per dollar invested, expressed in actual dollar terms. For example, a result of $1.80 means the project is expected to generate $1.80 of value for every $1.00 invested, delivering a clear view of financial return. It helps decision-makers in your organization, quickly assess which projects offer the greatest economic benefit for the resources committed.
Anticipated Cost Savings
This metric estimates the total reduction in costs the organization expects to achieve as a direct result of the decision. Understanding anticipated cost savings helps evaluate the project’s impact on long-term overall financial performance.
Enterprise Value Improvement
This metric estimates how much a project or decision is expected to increase the overall value of the business to investors, owners, or acquirers. It considers long-term impact on profitability, risk profile, scalability, and strategic positioning. A higher enterprise value improvement score indicates that the initiative meaningfully strengthens the business’s market worth and future saleability.
Benchmark against other Projects
This metric compares the current decision against a standardized benchmark based on our three core evaluation criteria. It highlights how this initiative compares. For example on the Complexity Index of 35, the closer this decision's score to 35 it is an indication that this project has high complexity.
What is the Overall Risk Factor of this decision
This metric assesses the combined level of risk associated with the decision, factoring in various elements from the overall decision responses. It provides a consolidated view of potential challenges that could impact the project’s success or delivery. A higher risk factor signals the need for preparing stronger mitigation plans, closer monitoring, or possible reconsideration.
Likely Impact of not doing this Project
This metric evaluates the potential negative consequences of choosing not to proceed with the decision. Most organizations usually only ever look at the negative consequences of doing the project, Decise wants you to consider both directions. This metric considers potential losses, reputation damage, lost time etc. that may arise if action on this decision is delayed or avoided. Understanding this impact helps highlight the cost of inaction and supports more balanced, forward-thinking decision-making.

CONTACT US
[email protected]
0421 08 9979
501 Bourke St, Melbourne
VIC 3000, Australia
COMPANY
RESOURCES
Copyright © DECISE 2026 All Rights Reserved.